Day 2 in the Advent of Cyber 2023. McHoneyBell has been tasked with understanding the network at AntarctiCrafts' South Pole site. Though, she have concluded that no fancy technology exists at the site that captures events on the network.
WARNING: Spoilers and challenge-answers are provided in the following writeup.
Official walk-through video is as well available at Youtube - HuskyHacks.
Day 2 - O Data, All Ye Faithful
Today's challenge is all about data science and how we can use it analyzing logfiles using python, that we can use to gain insights into understanding the AntarctiCrafts' network.
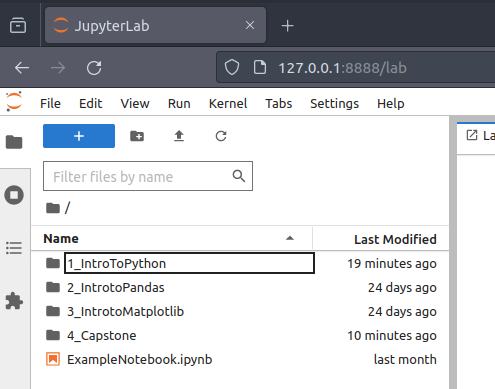
We are provided with a machine preloaded with JupyterLab which is a very common tool in data science and Cyber Security used to document and interact using python and some of the more common python-libraries used in the field: pandas and matplotlib. In the task, as well as in the machine, as seen in the image below, a quick introduction to all these tools. If you haven't worked with the tools before - I'll highly recommend to walk through these to obtain a basic understanding and skill in using these.
The Challenge
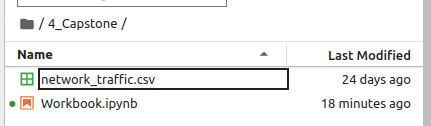
We are provided with the logfile network_traffic.csv, as we can see in the image below for the folder 4_Capstone.
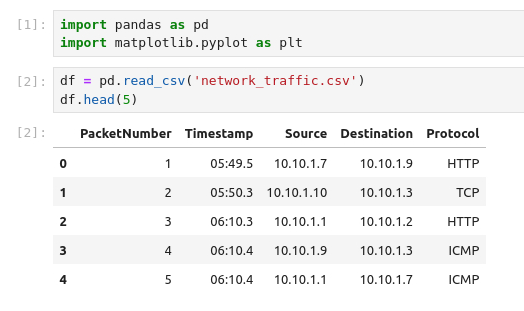
Opening the Workbook.ipynb from within the folder, we can see that a prepared Jupyter Notebook has been prepared for us. In the below image we can see that the libraries are imported in the first code-block. While in the second code-block the content of the provided CSV-file is loaded into a pandas dataframe called df. They do as well print the first 5 series from within the dataframe to show this two-dimensional structure of rows and columns. Another way of seeing the structure of a dataframe - especially if its large, is to use df.info().
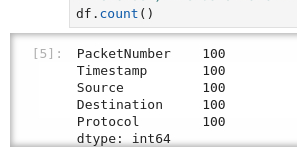
First question about the amount if packets that have been captured can be answered by utilizing the .count() function of pandas dataframes.
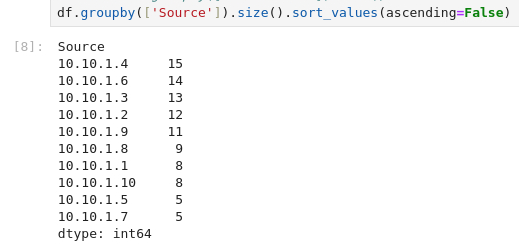
Next question we need to figure out which IP address that sent the most amount of traffic during the packet capture. As we do not have a bytes-column in the dataset, it might just be the sheer number of packets for the IP address that we can aggregate on. So for that, we start by grouping the data on the "Source" column and for easy measures we sort the output in descending order to get the biggest first.
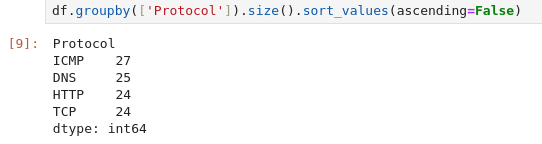
The last question about the most frequent protocol is kind of the same type of answer. We need to group by the "Protocol"-column and again for good measures we sort the output.