Day 17 in the Advent of Cyber 2023. Over the first couple of days in this Advent of Cyber, we have been through prompt injection, log analysis, brute force, data recovery, exploitation, malware, account takeovers and much more. How can we zoom out a bit and create a timeline to set the investigation's initial boundaries and scope? McSkidy decides to focus on network statistics. When there are many network artefacts, it's a good choice to consider network in & out as well as load statistics to create a hypothesis. Now it's time to help the SSOC team by quickly checking network traffic statistics to gain insight into the ongoing madness! Let's go!
WARNING: Spoilers and challenge-answers are provided in the following writeup.
Official walk-through video is as well available at Youtube - MalwareCube.
Day 17 - I Tawt I Taw A C2 Tat!
Two types of network analysis is either going deep and looking at all the packets and their payload. This is often referred to as "Packet analysis" and involves .pcap files and tools like Wireshark, tshark and so on. These gives us the full picture into what happens on the network and further gives us the ability to unpack the payload, and with the right tools and keys, unencrypt data to understand exactly what an adversary have performed over the network - which tools they have downloaded, what they have uploaded. But this type of network analysis also requires quite a lot of resources as it replicates the traffic one-to-one.
Another way is to use "Network flow data" - commonly via the format NetFlow, which is a telemetry protocol developed by Cisco. Though it has been superseeded with a basis in version 9 to an IETF protocol called IPFIX.
Both are summary data and metadata. There are no detailed payload, meaning that one will not be able to deep dive into deep packet analysis, but it is much more efficient looking for abnormalities, DOS/DDOS attacks, Indicators of Attack (IOA) and such analysis that rapidly can be used to steer the analysts focus in a hunt or incident response.
The Challenge
In today's challenge we're provided with an analyst-machine preinstalled with the tooling SiLK used for analyzing Netflow data, as well as a capture of some suspicious netflows.
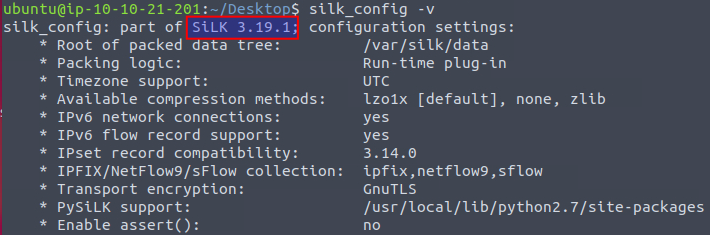
For our first question, we need to answer which version of SiLK is installed on the machine. We can use the flag -v on the command silk_config to see information about the installed application.
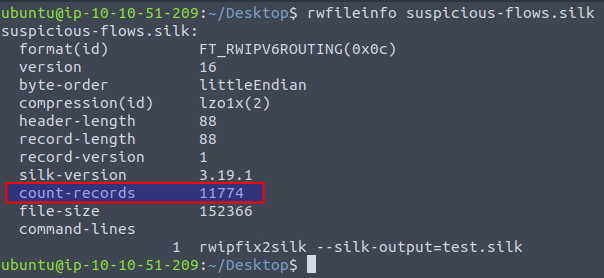
Next up we need to find the number of flows or "records" in the capture, which we can find by running the command rwfileinfo <FILE>.
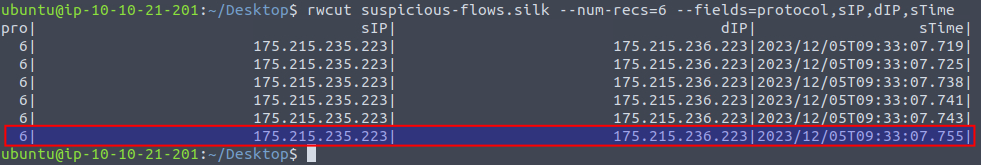
We now need to find the start time of the sixth record in the capture. Using the rwcut we can cut the capture and only show the first six records by using the flag --num-recs=6. We can also define which columns we want to show by using the flag --fields=
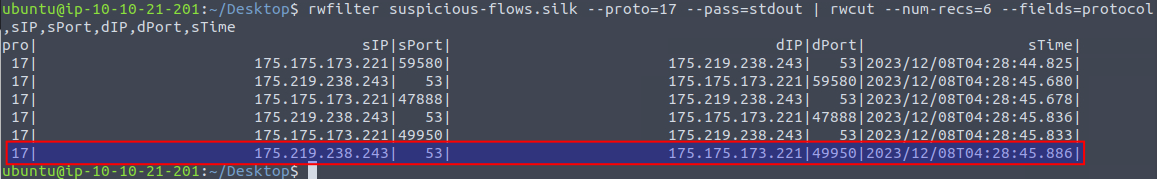
In the fourth question, we're tasked with finding the destination port (dPort) for the sixth UDP record. This means that we first need to filter the captured records. We can do that with the command rwfilter with the flag --proto=17 to filter on protocol. 17 is the decimal used in netflow to denote the UDP-protocol (6 is TCP, 1 is ICMP and so on), then using the flag --pass=stdout so that we can pass the output of the filter-command via a pipe to rwcut where we again use flags to limit the output to six records and the columns we're interested in.
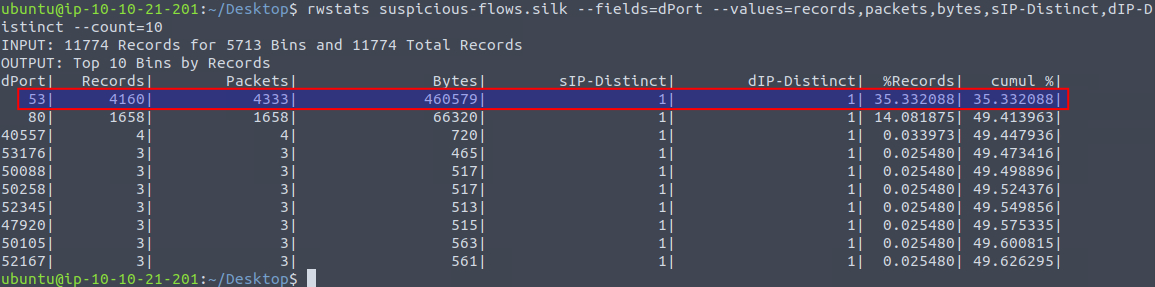
Next question is about finding the percent of records going to a destination port of 53 also normally used for DNS. For this we can use the command rwstats where we summarize on the dPort via the flag --fields=dPort and use the flag --values= to determine which columns we want to see. The flag --count=10 is used to cut the amount of output to only the first 10 bins.
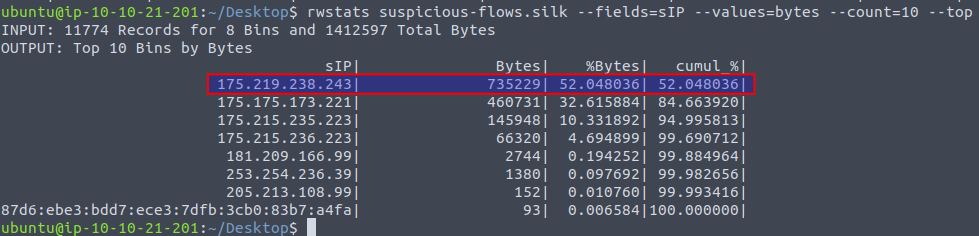
We're then tasked with finding out the number of bytes transmitted by the "top talker" on the network. We can use the command rwstats again, but this time summarize using the source IP via --fields=sIP and using --values to define the columns we want to see, --count to limit the amount of bins and lastly --top to ensure that we're seeing the top of the list.
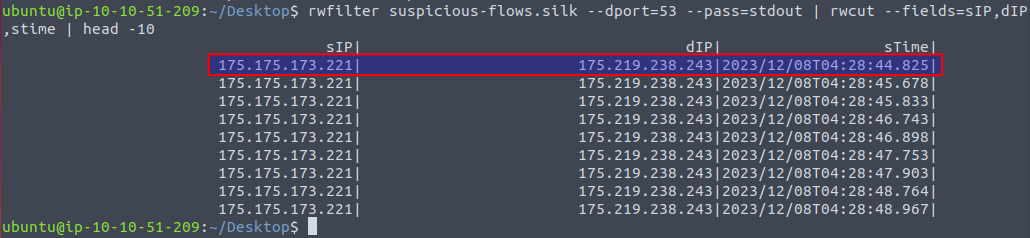
In the next question we're asked to find the start time value for the first DNS record going to port 53. We can use rwfilter to filter on the destination port via --dport=53 and then pipe it to rwcut where we can control the columns and lastly pipe it to head to only show the first 10 records.
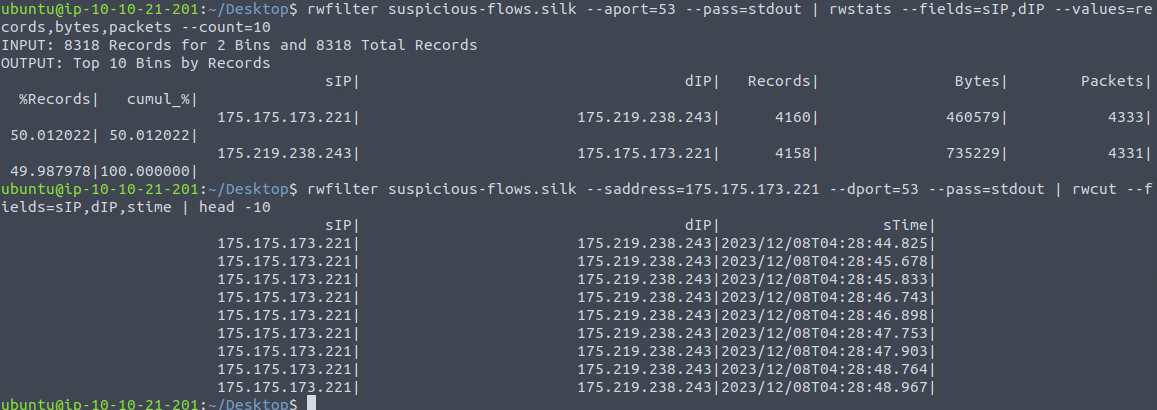
Then we're questioned what the IP address of the host that the C2 potentially controls is (and in defanged format). We know from earlier rwstats commands, that there is an abnormal amount of traffic, in relation to what else traffic there is, on port 53 which normally is used for DNS. So, firstly we use rwfilter to filter for any port using 53 and then via rwstats we can summarize on the IPs, giving us two IP addresses communicating on port 53.
Then taking a closer look on the first IP 175[.]175[.]173[.]221 and its communication to destination ports for 53, we can see that it sends many records in a very short time. This is a bit abnormal and could indicate that the traffic is merely encapsulated DNS and actually is C2-traffic tunneled through DNS packages.
In the second last question we are asked which IP address is suspected to be the flood attacker. From earlier when we summarized on ports in the capture, we we well saw a lot of traffic to the port 80. So, starting looking at this traffic we can use rwfilter and restats to filter on the port 80 and summarize on IPs. This gives us two distinct IPs that seems to be using port 80. In the question we're informed about a flood attack, so we're interested in traffic where port 80 is the destination. We can then use rwfilter and rwstats to filter on port 80 and summarize on IPs. This gives us an IP of 175[.]215[.]236[.]223 that we can see in the below image at (1) to be the IP sending quite a lot of traffic to the destination port 80 (1658 records). And further, at (2) we can see that many of the records are TCP-SYN (first part in the three-way handshake, seen by the flag s) within a single second. Surely, we have found to offending IP for the second last question.
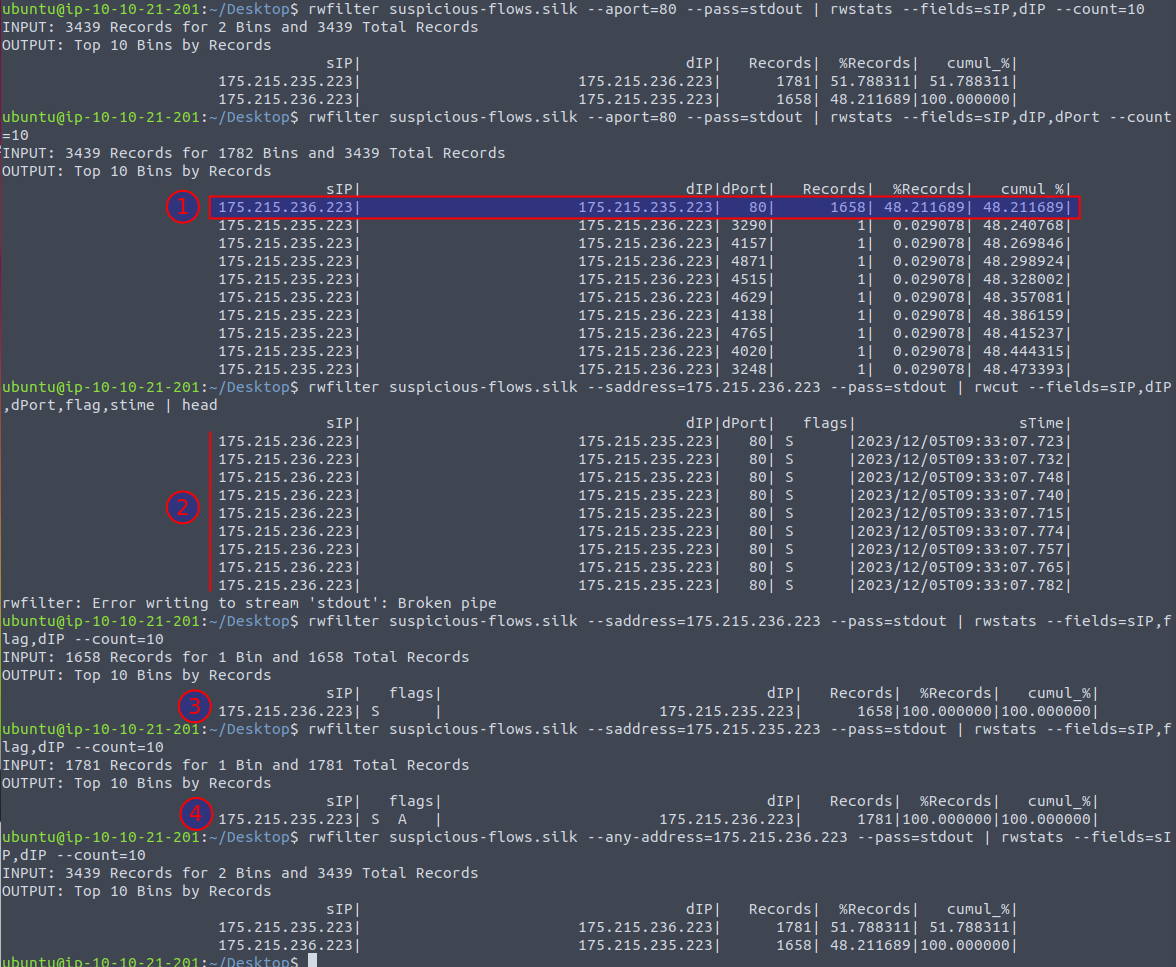
For the last question in today's challenge, we're tasked with finding the number of TCP-SYN packet records within the capture. Building upon the findings from last question, we can then use rwfilter and the flag --saddress= to filter for the source address that we just found, as seen in the image above at (3) - and then we as well get the amount of records for the answer.
Just for good measure, we can dive a bit further into the TCP-SYN flood. Knowing that the TCP protocol relies on a Three-way handshake to initialize a connection, we should be able to see a good amount of SYN, SYN-ACK and ACK packages. With both SYN and ACK being sent by the initiator (or often the "client"), and the SYN-ACK coming from the "server". A SYN flood is clearly seen as we can use rwfilter and rwstats to see that the offender is sending a lot of SYN-packages to the server at 175.215.235.223 seen in the image above at (3). At (4) we can further see that the server is indeed answering with the second step in the handshake by sending SYN-ACK back, but we do not see any answers via ACK flags from the offender.